PROJECT INFO
Type
Midterm Project
School
Harvard Extension School
Date
2021
Role
Visual Design


Type
Midterm Project
School
Harvard Extension School
Date
2021
Role
Visual Design
I’ve always been captivated by data visualization. As a highly visual person, I believe that seeing information presented visually is the most effective way to truly understand data.
After collaborating as a UX Designer on a data visualization tool project at Oracle, I realized I wanted to dive deeper into the actual data itself. This curiosity led me to enroll in The Art and Design of Information course at Harvard Extension School, where I submitted this Midterm Project.
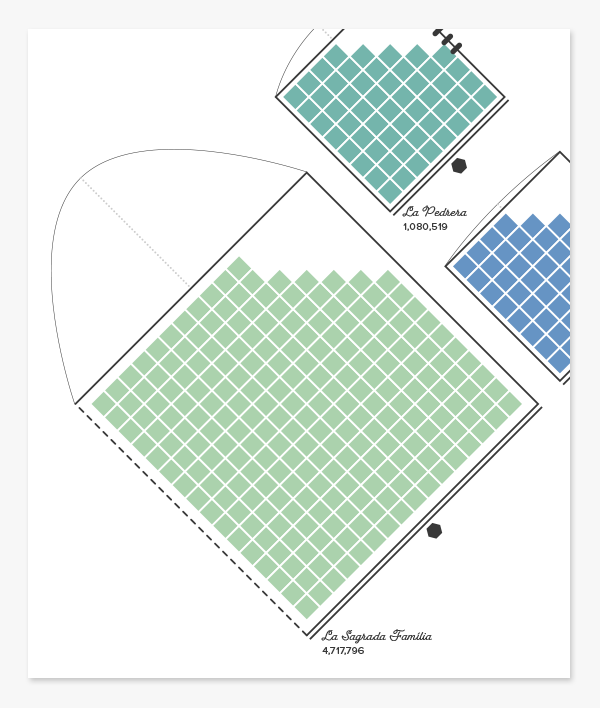
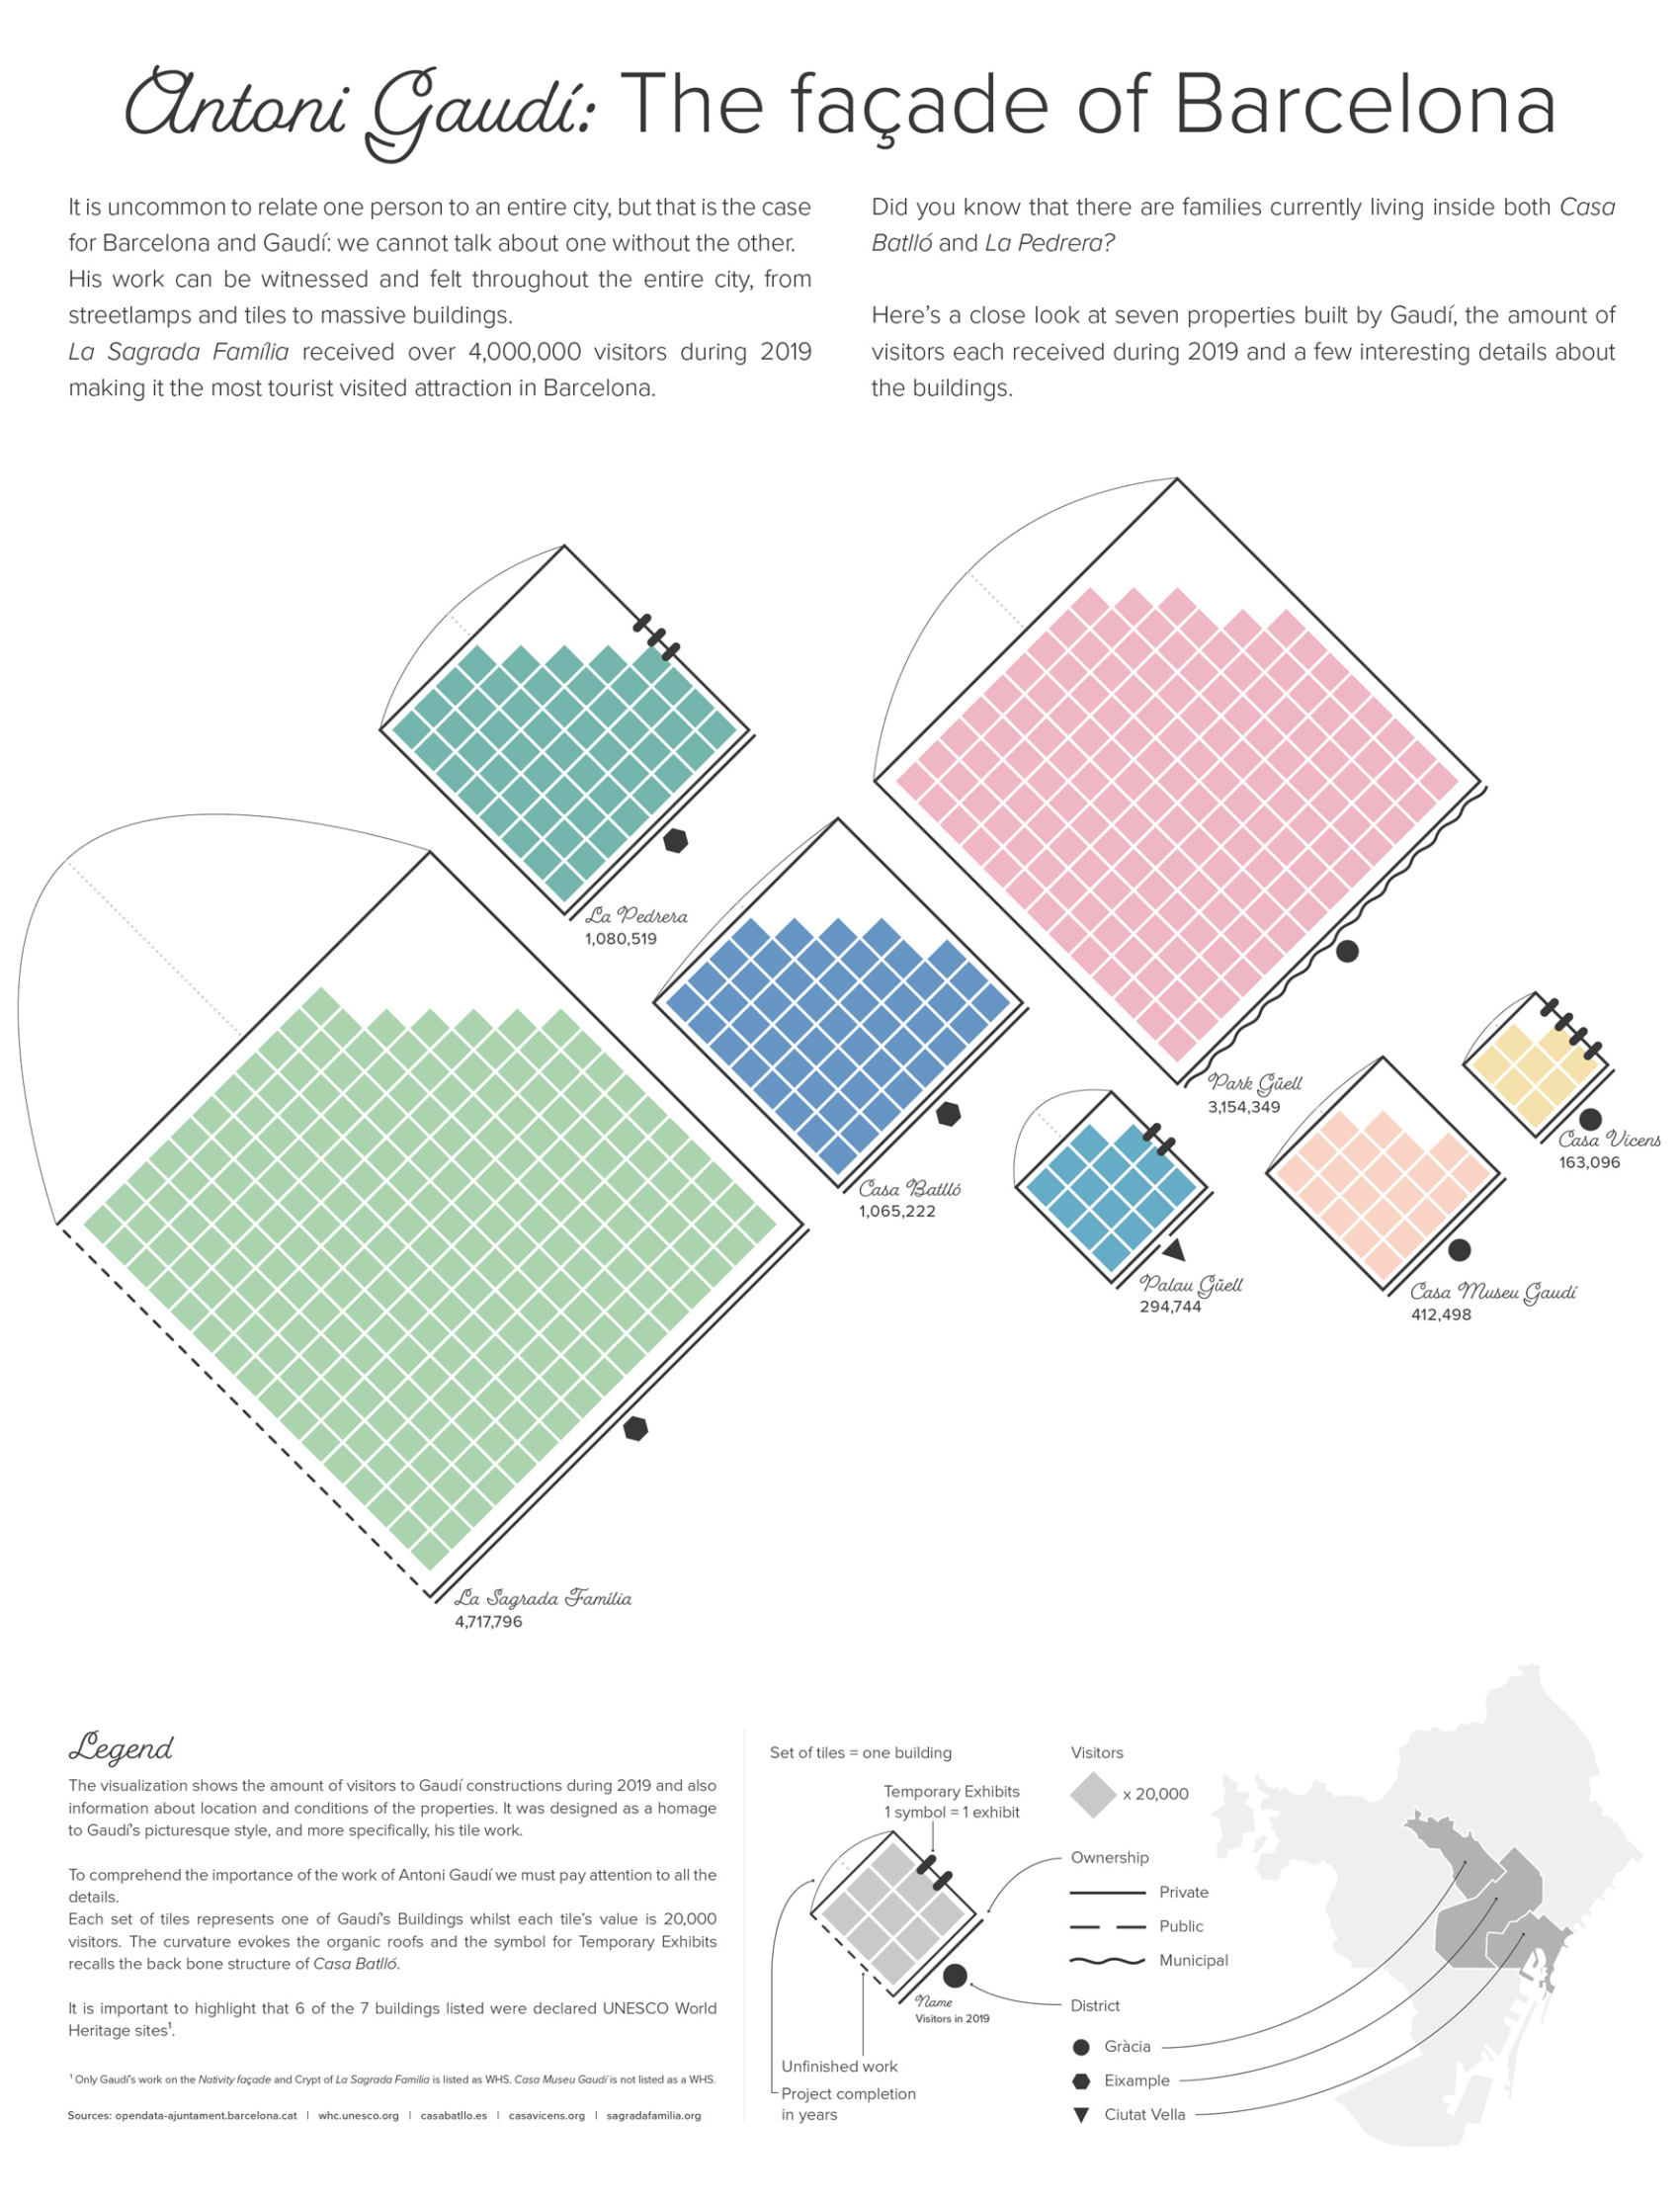
For this project, I selected a dataset from the Open Data Barcelona site to develop a narrative and create a custom visualization. As soon as I saw the available datasets, I knew I wanted to explore data related to Antoni Gaudí’s iconic works. I focused on museum and cultural data, specifically the number of visitors to Gaudí’s buildings in 2019, while also incorporating additional information about the properties themselves.
Hommage to Gaudi’s work
As reflected in the visualization, I aimed to infuse as many references to Gaudí’s architectural genius as possible:
This project is not only an exploration of Gaudí’s work but also a celebration of the intersection between art, architecture, and data visualization.